Crime rates can be difficult to understand if you don’t have factual numbers in hand. Unfortunately, because it’s so easy to access information in the modern age, it’s become easy to worry that the United States is becoming more dangerous. Is that really the case? Here’s what you need to know about the changing crime rates in the United States.
 America’s Changing Crime Rates Created By: PeopleFinders
General Crime Nationwide
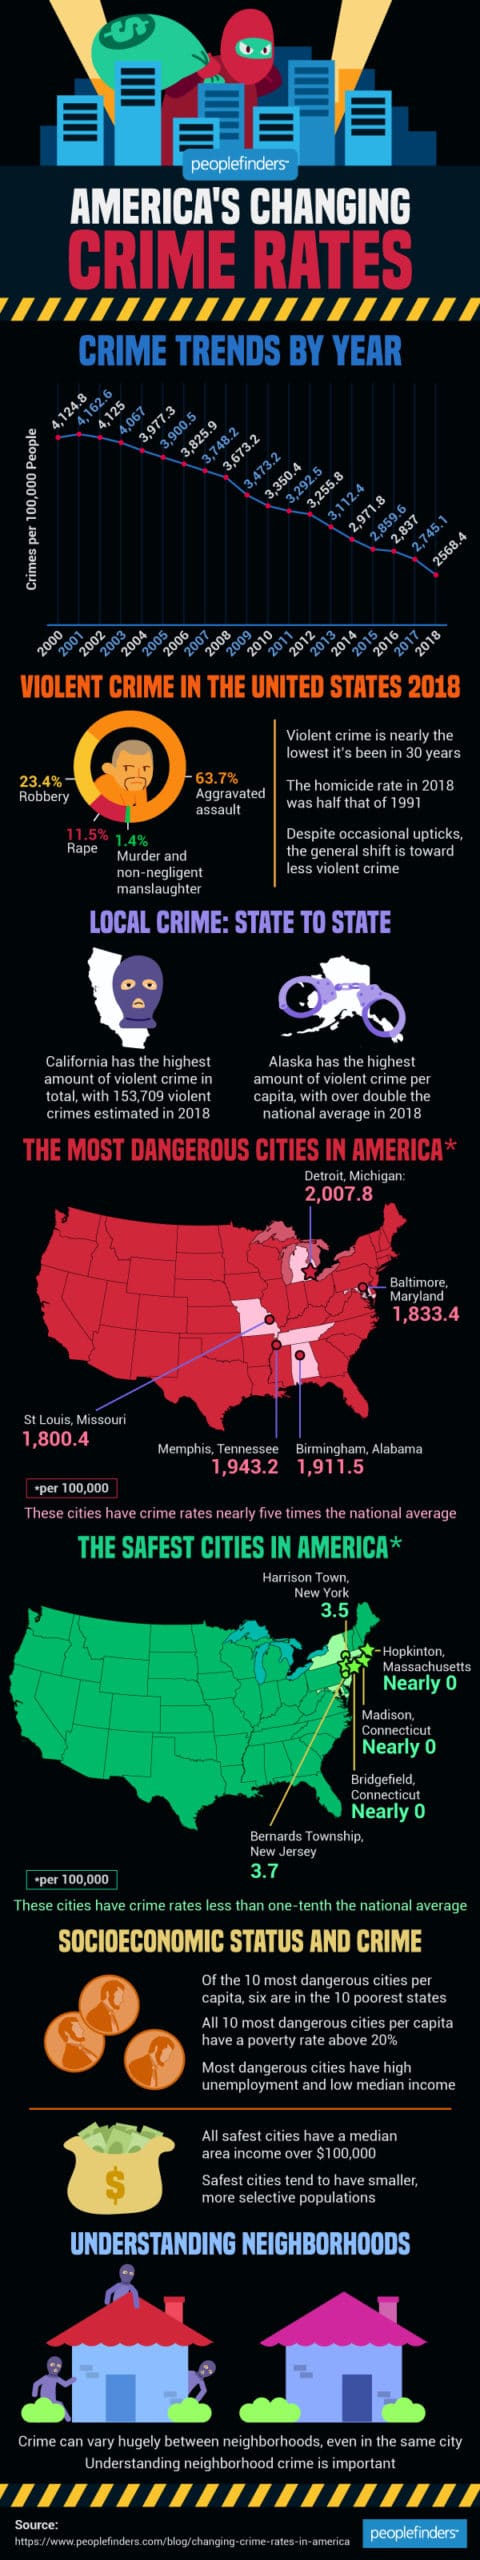
First, you might want to look at overall crime. The FBI’s statistics actually paint a better picture than you might assume when it comes to crime per 100,000:- 2010: 3,350.4
- 2011: 3,292.5
- 2012: 3,255.8
- 2013: 3,112.4
- 2014: 2,971.8
- 2015: 2,859.6
- 2016: 2,837
- 2017: 2,745.1
- 2018: 2,568.4
As you can see, since 2010, overall crime has actually gone down every year. Overall, it’s gone down by a whopping 23% in only eight years.
Violent Crime Specifically
Violent crime tends to give more of an understanding of “safety.” Here are the FBI’s violent crime statistics per 100,000 since 2010:- 2010: 404.5
- 2011: 387.1
- 2012: 387.8
- 2013: 379.1
- 2014: 375.7
- 2015: 372.6
- 2016: 386.3
- 2017: 382.9
- 2018: 368.9
As you can see, it’s similarly going down, though it’s a bit more of a rocky process than overall crime. Additionally, violent crime was only about 14% of all crime in 2018, making it much less common than you might assume from the news.
The Most Dangerous Places
What about the most dangerous end of the scale? These are possibly the five most dangerous cities in the United States, with violent crime rates at nearly five times the national average:- Detroit, Michigan: 2,007.8
- Memphis, Tennessee: 1,943.2
- Birmingham, Alabama: 1,911.5
- Baltimore, Maryland: 1,833.4
- St Louis, Missouri: 1,800.4
The Safest Places
On the other side, there are certain safer locations in the United States. These may be the five safest cities in the United States, with crime rates less than a tenth of the national average:- Hopkinton, Massachusetts: Nearly 0
- Bridgefield, Connecticut: Nearly 0
- Madison, Connecticut: Nearly 0
- Harrison Town, New York: 3.5
- Bernards Township, New Jersey: 3.7
Socioeconomic Impact
Socioeconomic status is one of the best predictors of safety. When you look a bit deeper into the most and least dangerous cities, you find out some interesting elements:- Six of the 10 most dangerous cities are in the 10 poorest states
- The 10 most dangerous cities per capita have a poverty rate above 20%
- The safest cities have a median area income above $100,000
- Dangerous cities tend toward having high unemployment and low median income
As you can see, living in a poorer area makes it more likely that you’ll also be in a more dangerous area. It’s important to consider socioeconomic status when looking at safety.